Platform · TRAIN

One governed causal model of how your operation behaves.

TRAIN is a governed causal-inference platform that connects enterprise knowledge, operating data, models, and decision workflows. It learns normal behavior, explains deviations, evaluates interventions, and updates as new evidence arrives, all within your environment.

Scroll down · outcomes, the model, and the capability lifecycle
20% / 22%
Lower grade-transition losses (20%) and higher throughput (22%) on semi-batch lube units.
30%
Fewer unplanned shutdowns through alarm rationalization on a delayed coker.
2–5%
Fired-heater energy-efficiency gain, with roughly 10% lower emissions.
>50%
More rotating-equipment uptime from one causal model of operations, maintenance and cost.

Parabole's platform addresses decisions across upstream, midstream, downstream and adjacent process industries, run in self-service mode within each customer's own infrastructure. See the oil & gas portfolio →

What it is

A causal decision layer, not another predictor.

Traditional knowledge graphs and machine-learning models recognize patterns from history. Industrial decisions turn on a harder question: why did this outcome occur, and which factors are truly driving performance?

Learns normal
Not a catalog of past failures.

Many monitoring systems focus on anomalies or known failure patterns. TRAIN begins with a causal model of normal operation and evaluates new conditions against it.

Causation, not correlation
Models how change propagates.

Tests candidate causal drivers against explicit assumptions, engineering constraints, refutation checks, and uncertainty estimates before presenting an intervention effect.

Continuously current
Temporal models that evolve with operations.

The causal model is re-estimated as feedstocks, equipment and operating regimes move, surfacing structural, directional and magnitude drift before it becomes a costly incident.

How it fits together

Evidence in, decisions out: one governed model in between.

Multimodal enterprise evidence feeds a living causal model. The seven-stage lifecycle runs on it, every skill level works from it, and the whole system sits inside your environment and your governance.

Multi-layered model

Three sources of truth, one governed model.

Every facility applies the same physics differently. TRAIN represents that reality in three complementary layers and fuses them into one Combined Causal Model.

PCM

Principle Causal Model

The first principles that govern the process: physics, chemistry, engineering relationships, operating constraints. Implementation-agnostic; rarely changes.

RCM

Rationale Causal Model

The reasoning, assumptions and practice developed by your engineers: procedures, maintenance practice, decades of judgment. Captures even minute operating changes.

SCM

Structural Causal Model

Learned directly from temporal process data, continuously updating how the operation behaves at this point in time.

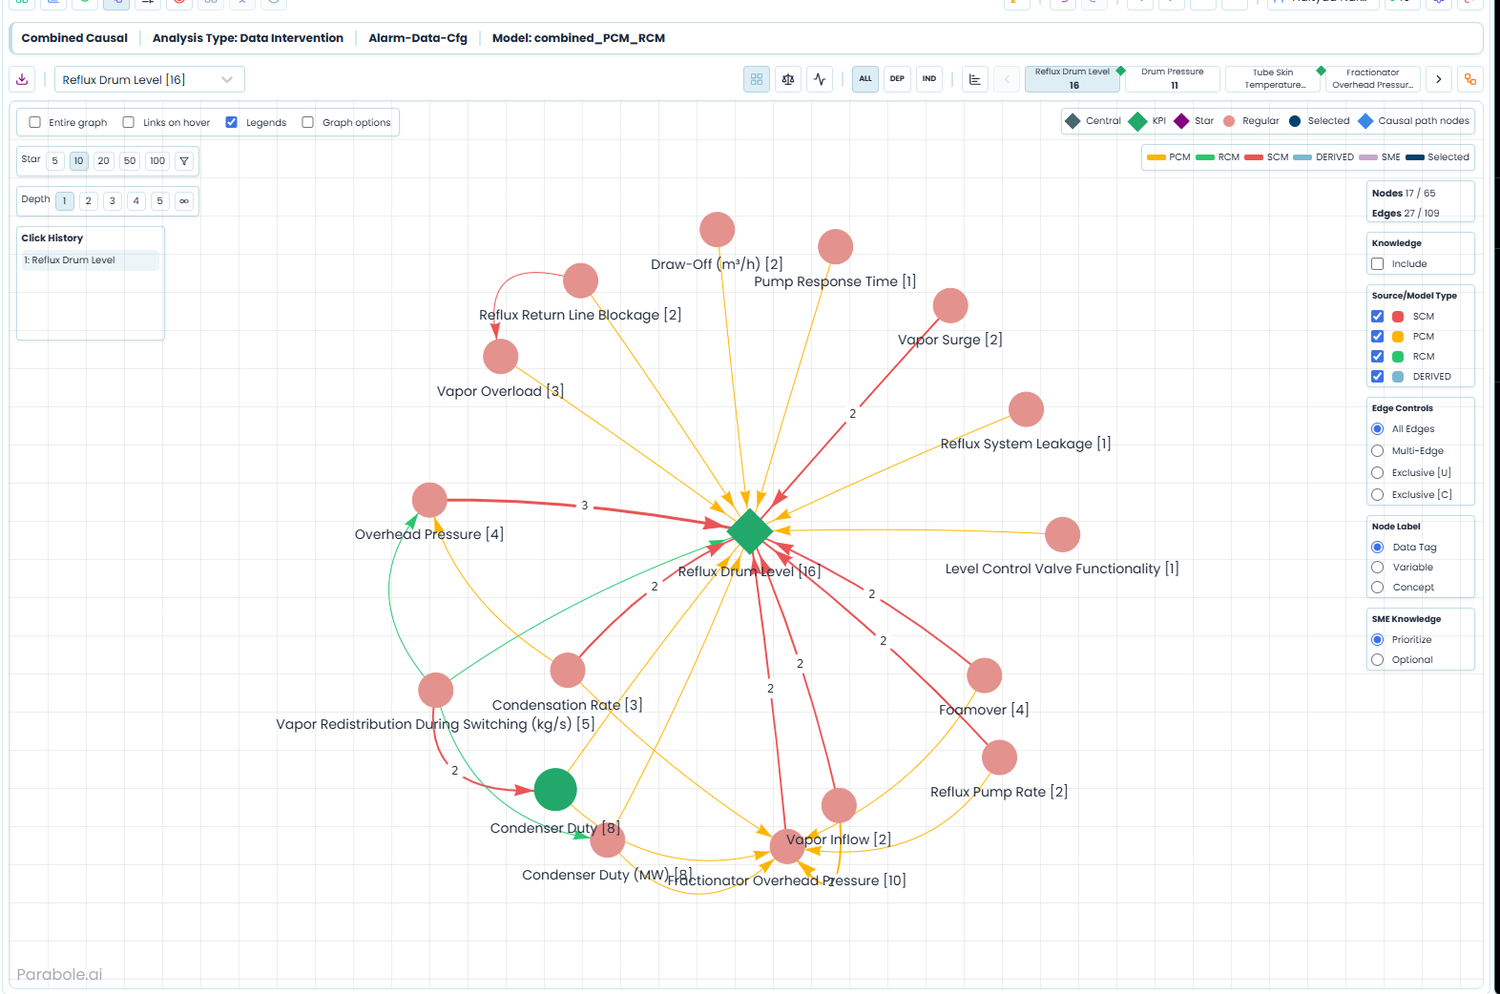
TRAIN screen: the Combined Causal graph for an alarm-flooding case, a radial network centered on Reflux Drum Level, with edges colored by source (PCM, RCM, SCM and derived) and a node and edge count in the panel.
The Combined Causal Model in the product: Principle, Rationale, Structural and derived relationships in one governed graph, colored by where each came from.Combined causal graph generation and view
The Life Cycle

The full causal-inference lifecycle, in one platform.

TRAIN is not a monolithic stack. Use a single capability, connect selected stages, or run the whole lifecycle, depending on the problem, the data, and your existing analytical environment.

In the product
01

Knowledge capture & structuring

Turns engineering documents, P&IDs, SOPs, FMEA records, ontologies and guided 30–60-minute SME interviews into structured causal models. Automates much of model generation from documents, data, and structured SME input, while retaining source-level lineage for supported inputs.

02

Causal discovery

Learns the baseline of normal system behavior from operational data and combines it with the Principle and Rationale models into one integrated, governed causal model.

03

Causal identification

Documents the assumptions behind each analysis, selects valid adjustment sets, and makes validity requirements and failure conditions explicit. Interoperates with open frameworks such as DoWhy and PyWhy rather than locking you into a proprietary method.

04

Effect estimation

Selects estimators suited to the question, data, and causal structure; compares methods; quantifies uncertainty and practical effect size; and applies placebo, sensitivity, and data-robustness tests.

05

Counterfactual inference

Evaluates counterfactual scenarios from the governed causal model, with assumptions, validity conditions, and uncertainty made explicit. Integrates with simulators, digital twins and physics models when scenarios run beyond the historical operating range.

06

User enablement

The same governed model, three ways in: no-code for operators and SMEs, low-code for process engineers, high-code for data scientists, working in a shared environment without every user becoming a causal-inference expert.

07

Decision support & policy optimization

Causal agents for root-cause analysis, continuous monitoring and optimization. Supported recommendations include a traceable rationale and are evaluated against configured operating, safety, and business constraints, human-in-the-loop or automated.

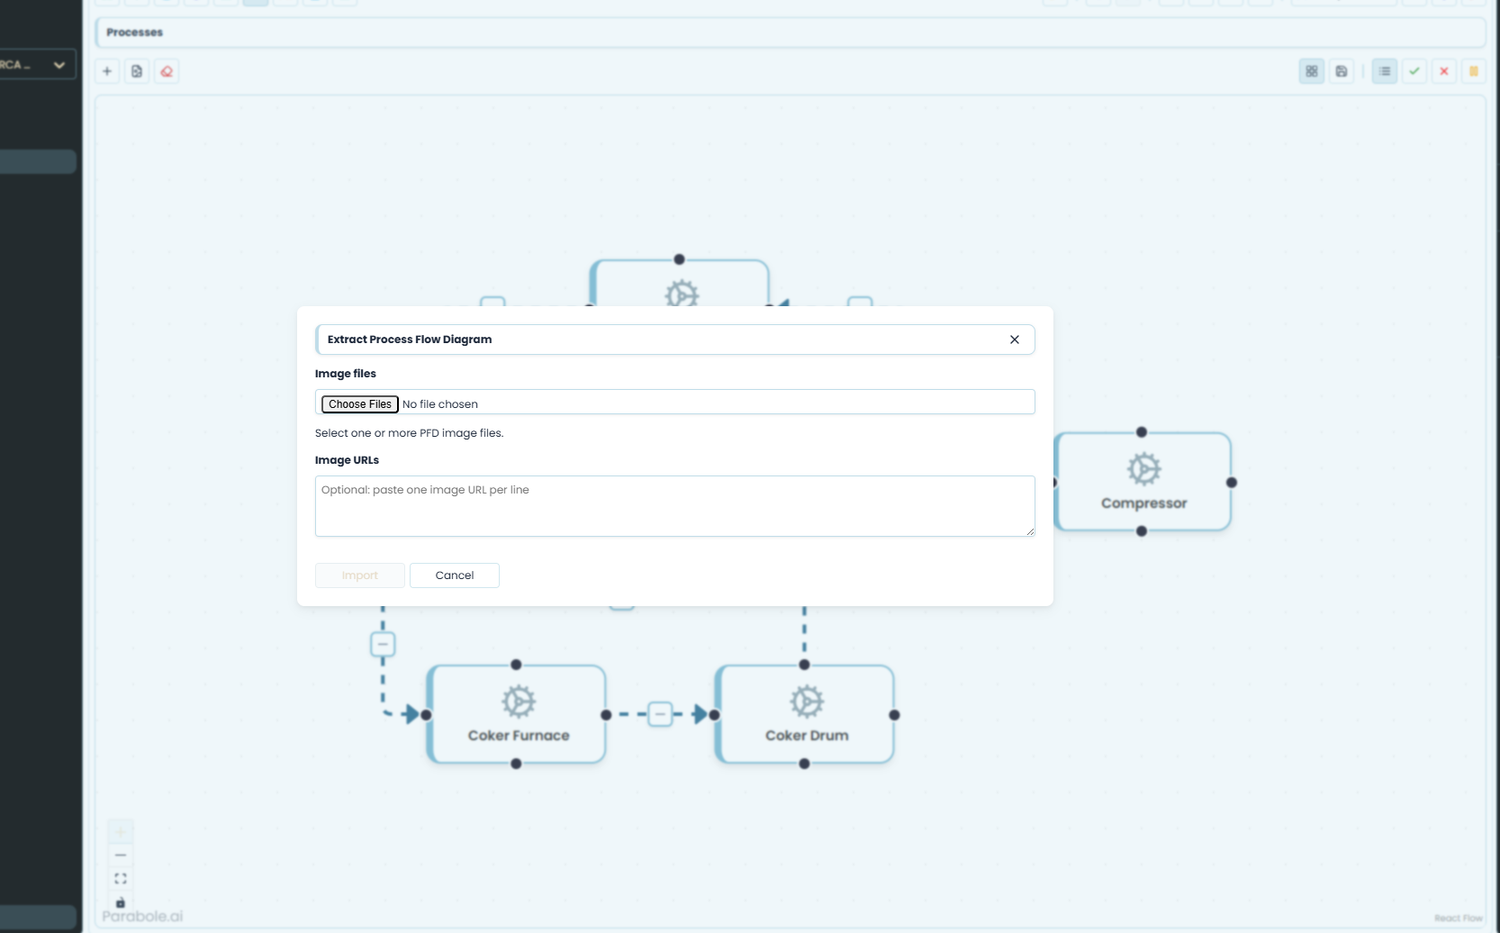
TRAIN screen: a process flow diagram of a coker unit with an Extract Process Flow Diagram dialog for uploading PFD image files.
Stage 1: a process flow diagram ingested as a teaching input for model construction.Industrial diagram (PFD) as input
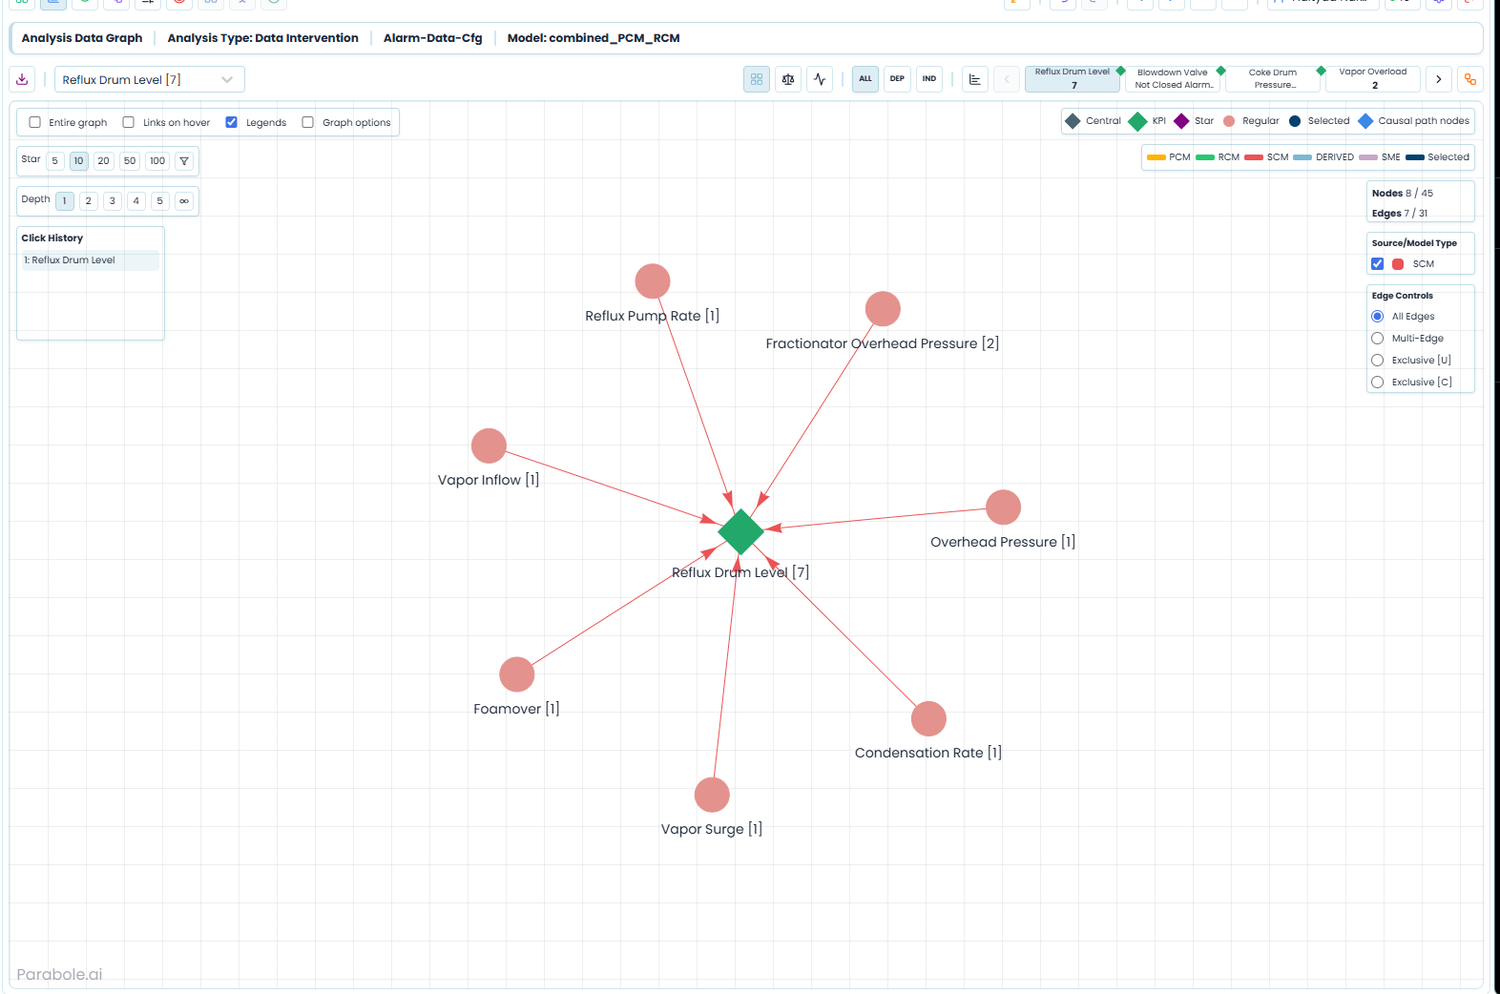
TRAIN screen: the data-derived causal graph for a case, a radial network centered on Reflux Drum Level with structural relationships learned from process data.
Stage 2: the structural causal graph learned from process data, before it is fused with the knowledge models.Data graph generation and view
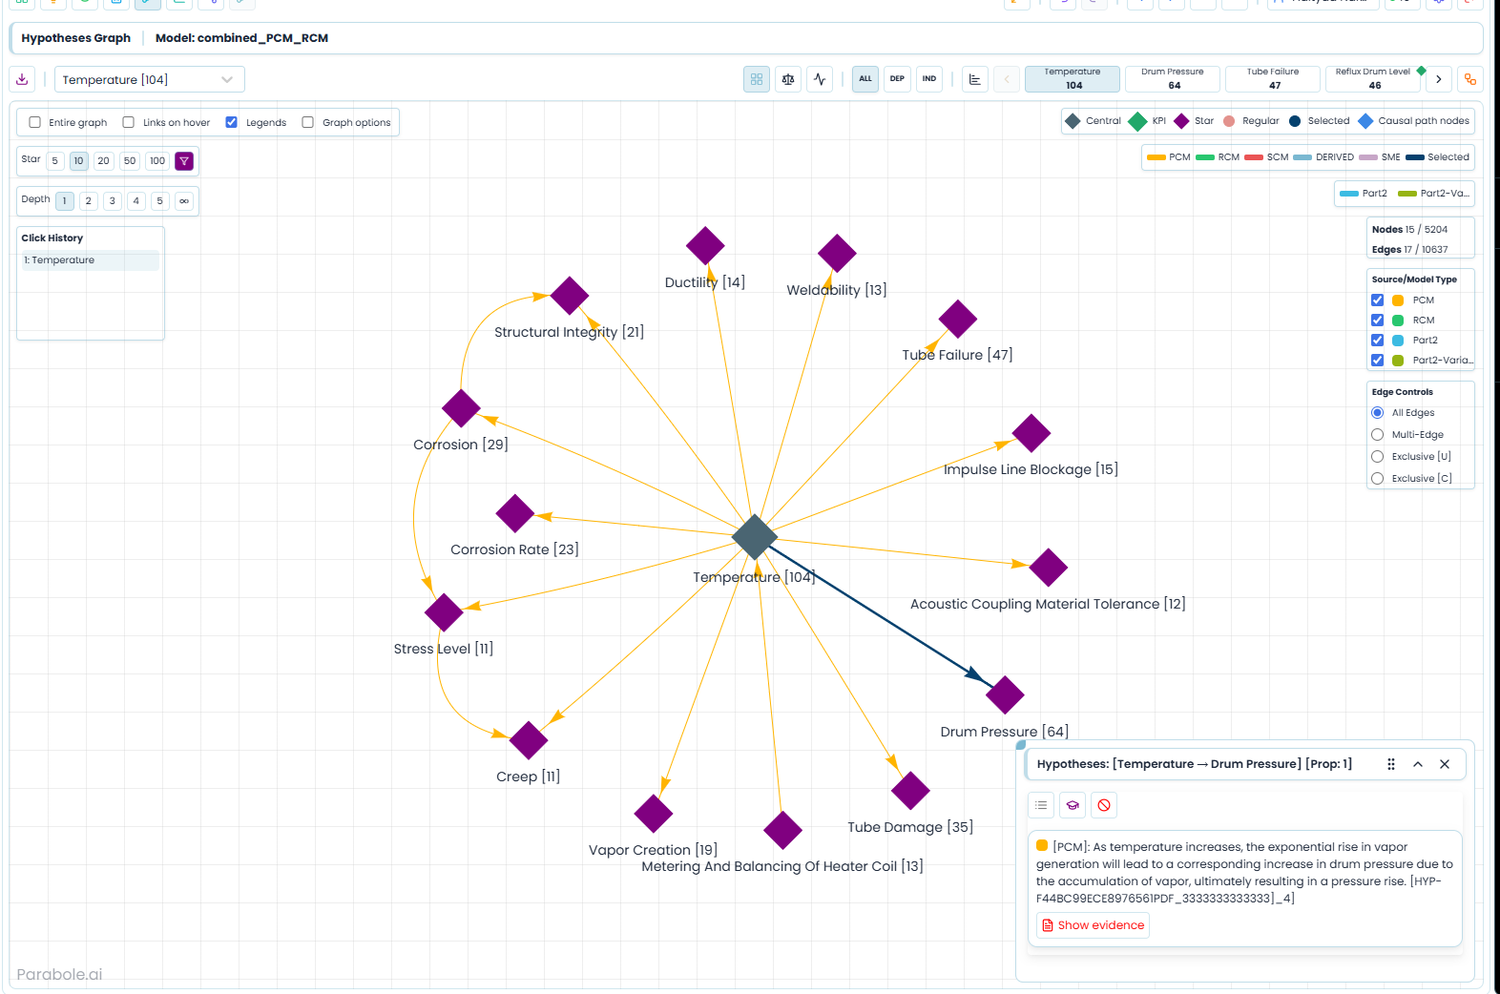
TRAIN screen: a hypothesis graph centered on Temperature with candidate causal relationships, and a panel showing one hypothesis with its supporting evidence.
Stage 3: candidate causal relationships as testable hypotheses, each with linked evidence.Hypothesis graph & evidence
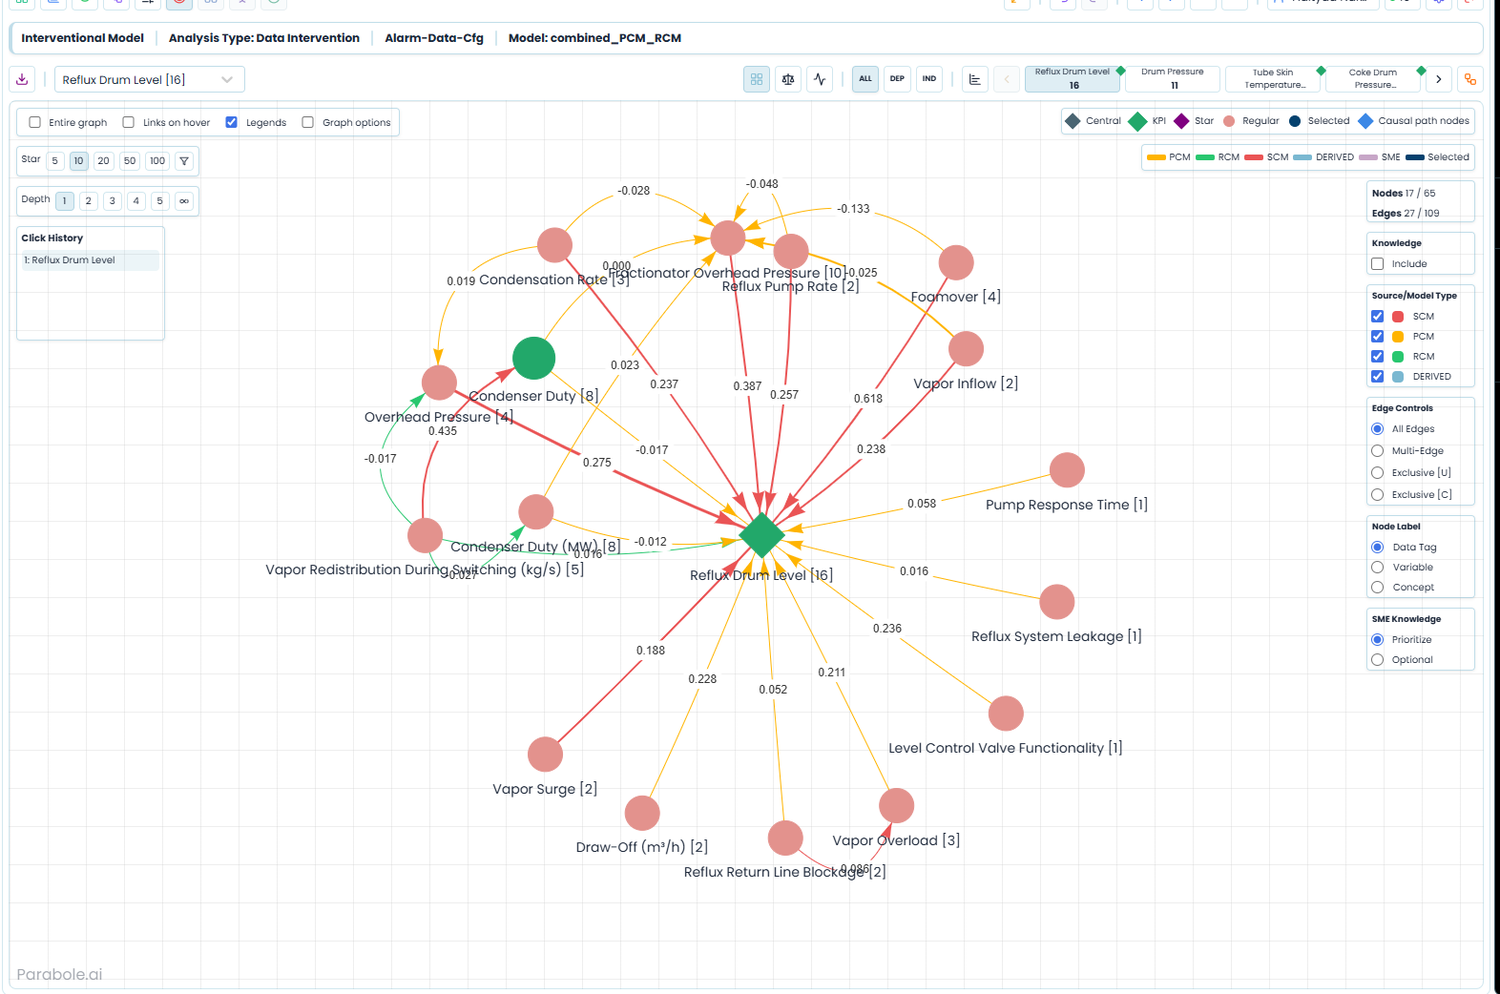
TRAIN screen: an interventional causal model with numeric causal scores on the edges around Reflux Drum Level.
Stage 4: the causal model with estimated scores and identification status on supported relationships.CCM with causal score
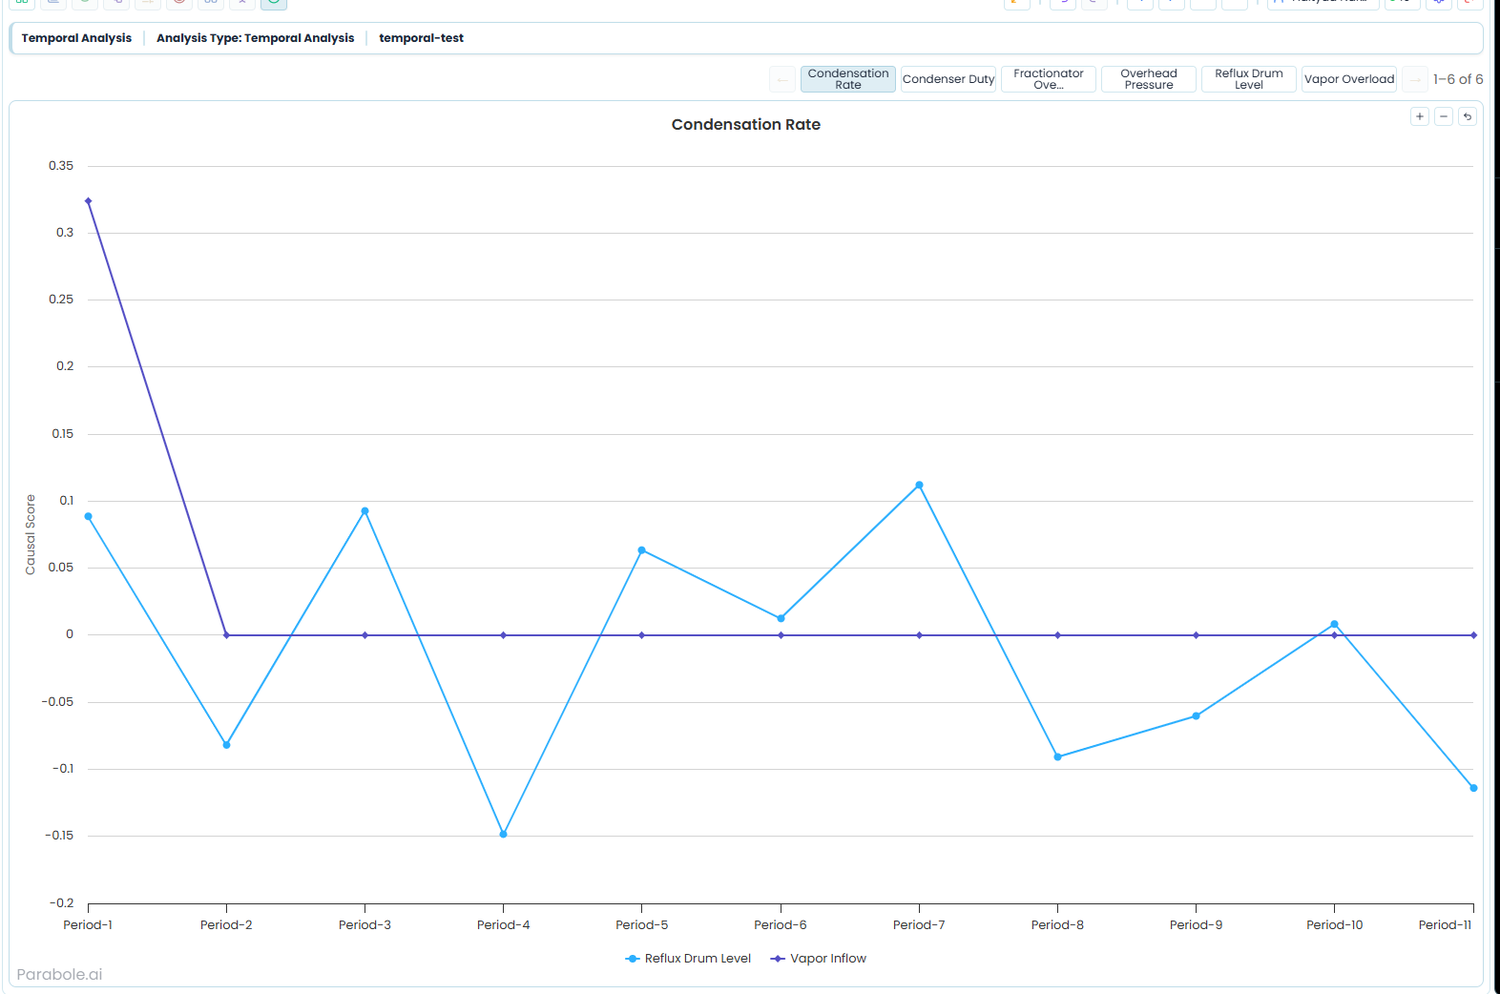
TRAIN screen: a temporal analysis line chart showing the causal score of two drivers on condensation rate over ten operating periods.
Stage 5: reasoning a scenario through time, how a driver's causal effect on the outcome evolves period by period.Factor analysis (temporal)
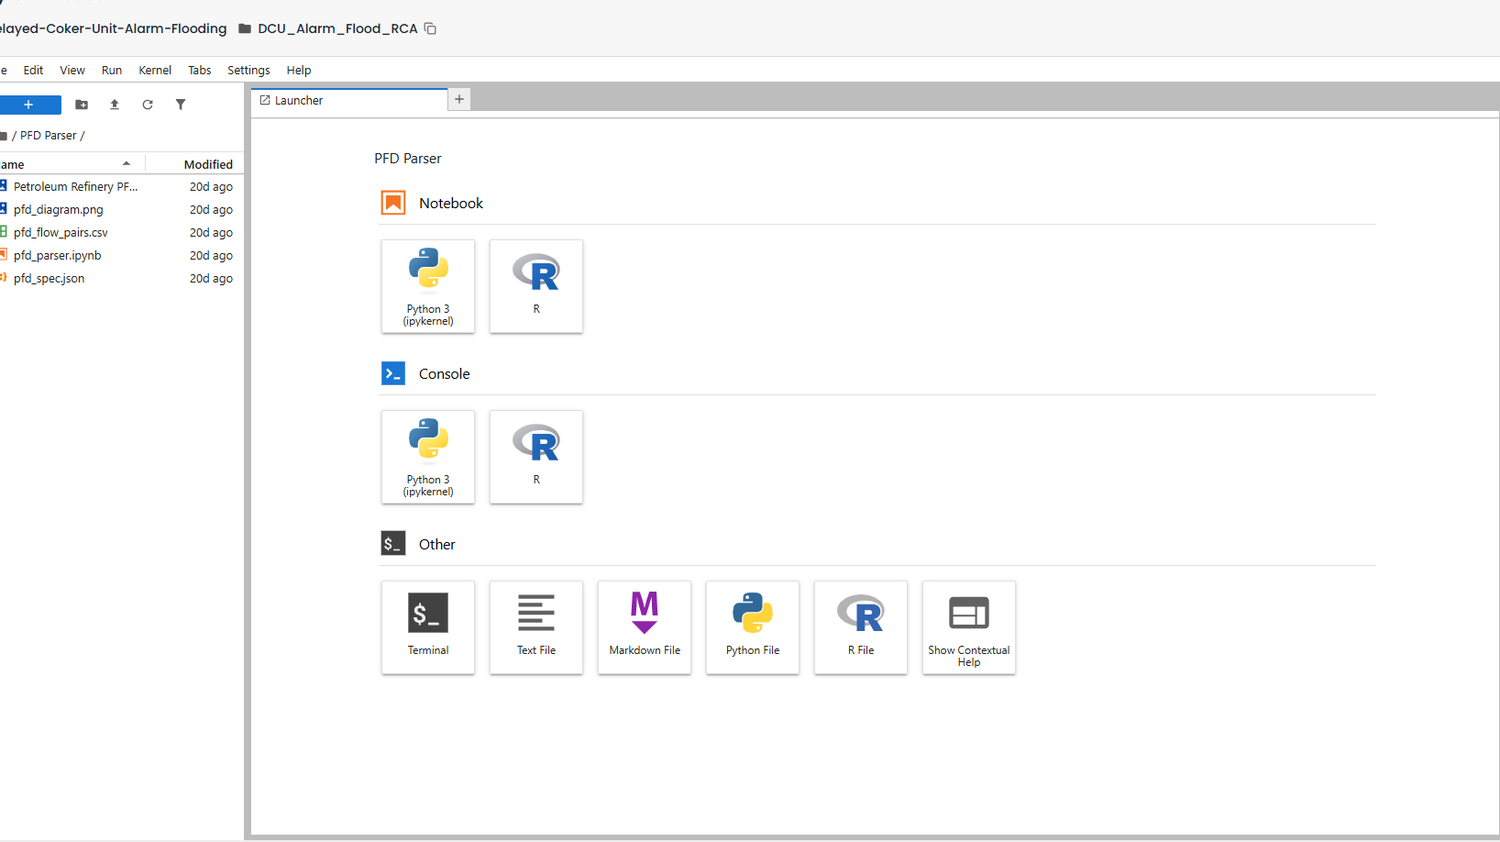
TRAIN screen: a Jupyter Notebook environment inside the platform with Python and R kernels and a PFD-parser notebook.
Stage 6: data scientists work the same governed model from Jupyter, in Python or R.Python dev environment integration (JupyterHub)
Definition

What normal actually means.

Not
A historical average or a golden batch.
Not
A setpoint, a spec limit, or a threshold on a tag.
Not
A catalog of past failure events.
Normal is
What the operating data says the process does, and what your engineers say it should do, held together against live conditions.
So

A different operating point is not necessarily a deviation because its constraints move with it. A meaningful signal occurs when observed relationships depart materially from the validated operating envelope.

Model validation & governance

A causal claim is only useful if it survives questioning.

Statistical significance alone is not treated as proof. TRAIN applies a layered validation regime before any estimate reaches a user, and reports weak or unidentifiable evidence rather than a number the data cannot support.

Estimand & graph validation

Confirms the quantity asked for is defined and identifiable, and checks the structure against first principles, process sequence and engineering constraints. Conflicts are surfaced for expert resolution.

Data suitability & robustness

Covariate overlap, sample size, missingness, temporal alignment and regime segmentation diagnostics, then comparison across estimator families, bootstrap and subset re-estimation.

Confounding & temporal stability

Placebo and random-common-cause tests, unobserved-confounder sensitivity, and re-estimation across time windows and regimes to expose drift.

External & operational validation

Review by subject-matter experts against engineering expectation (disagreements recorded as evidence, not suppressed) and outcome tracking that compares realized results against the expected effect.

Method benchmarking

Cross-checking against open causal frameworks (DoWhy, PyWhy, EconML) and reconciliation with simulation or first-principles baselines.

Full traceability

Models are versioned and assumptions documented. Supported events are logged with attribution and retained according to the configured policy.

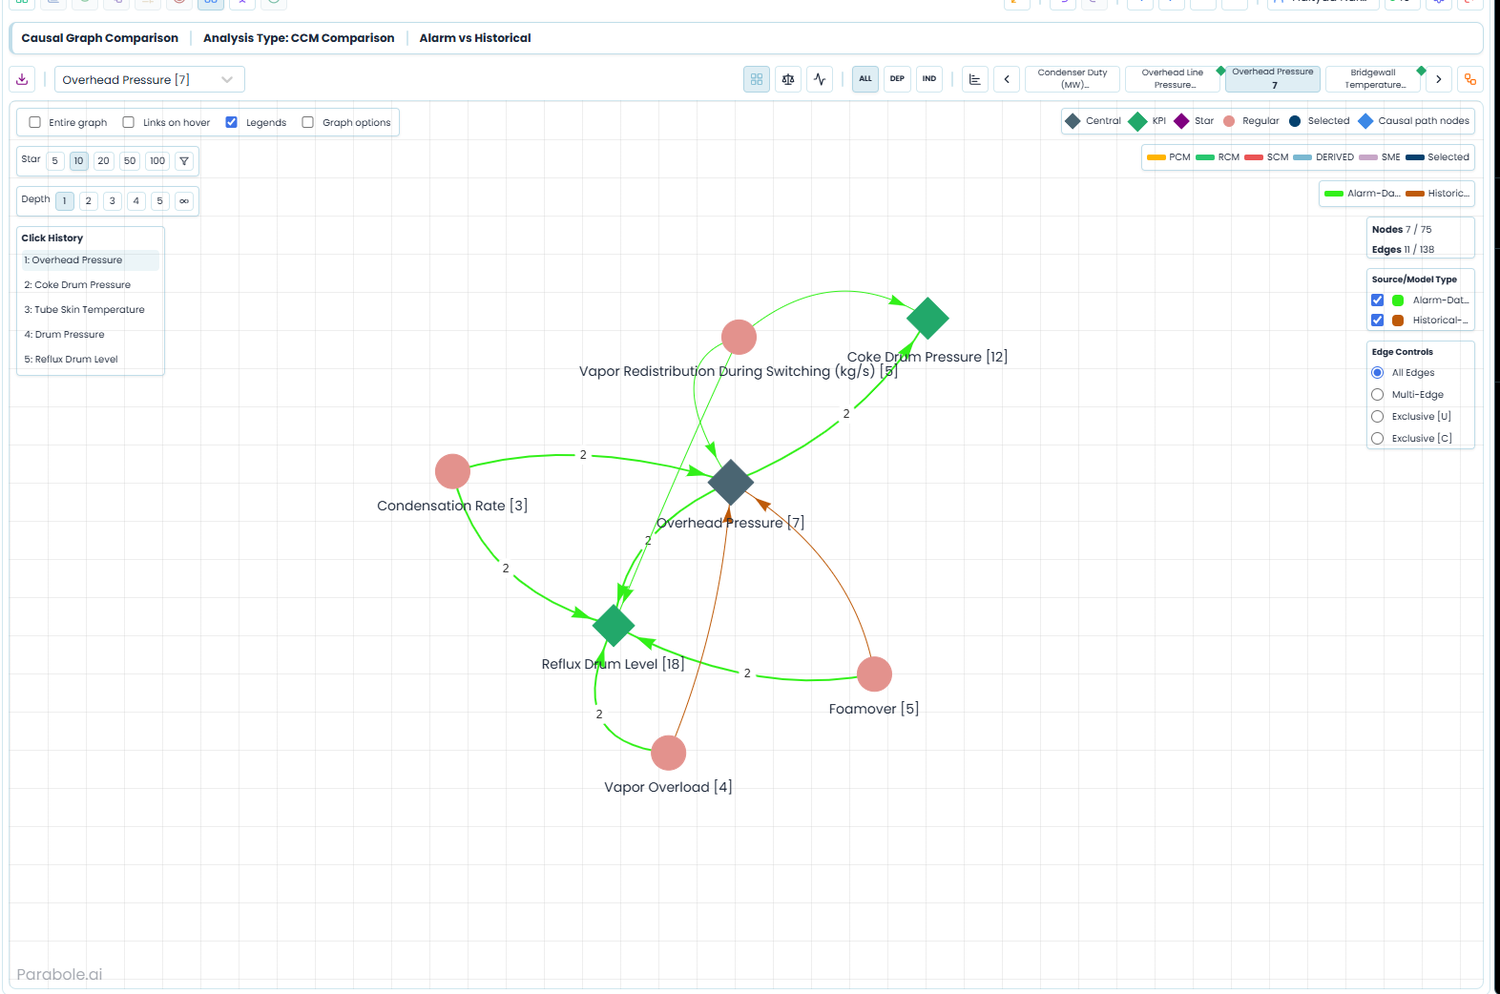
TRAIN screen: a causal graph comparison view, contrasting the current combined causal model against a historical baseline to expose structural and strength drift.
The current combined causal model compared against a historical baseline: structural, directional and magnitude drift made explicit.Model comparison on temporal scale
Access

One Causal Inference Platform. Four ways in.

Engineering-grade causal modeling, designed for self-service. The same platform, running one governed model, supports four roles: executive decision-makers, operators and SMEs, process engineers, and data scientists. Role-based enablement on your own use case builds an internal, repeatable capability, not a services dependency; the commercial journey (start with one decision, expand from there) is on Get started.

No-code · Executives

Decide

Outcome, intervention, value and governance: see what drives performance, compare interventions and their expected value, and track realized operational and financial impact.

No-code · Operators & SMEs

Operate

Knowledge contribution, deviation investigation and action: contribute operating knowledge, investigate deviations without code, and act on explained causes with the evidence and constraints attached.

Low-code · Process engineers

Engineer

Configure analyses, compare scenarios and generate reports from persona templates, with assumptions rendered visible at every tier.

High-code · Data scientists

Extend

Full flexibility through Jupyter notebooks, Python and R integrations, APIs and custom estimation methods, inside the same governed model.

Fits your stack

A causal layer above your data foundation.

TRAIN strengthens the historians, platforms, models, and solvers you already use. It adds a causal layer without replacing your existing data foundation.

Ingests from

Historians, data lakes, lab / MES / CMMS systems, engineering documents and P&IDs, ontologies and knowledge graphs, and the outputs of your analytical models.

Publishes to

APIs, Jupyter, dashboards, simulators and physics models, ML models, MILP solvers, APC / MPC stacks, and agentic workflows.

With ML and optimization

Can supply causally informed inputs, objectives, and constraints to ML and optimization workflows; supported configurations can screen infeasible regions before solver execution.

With language models

TRAIN is not an LLM. It can run a local model inside your perimeter; in one documented diagnostic test, evidence selection reduced input tokens from approximately 15,000 to fewer than 8,000 while preserving the reviewed recommendation.

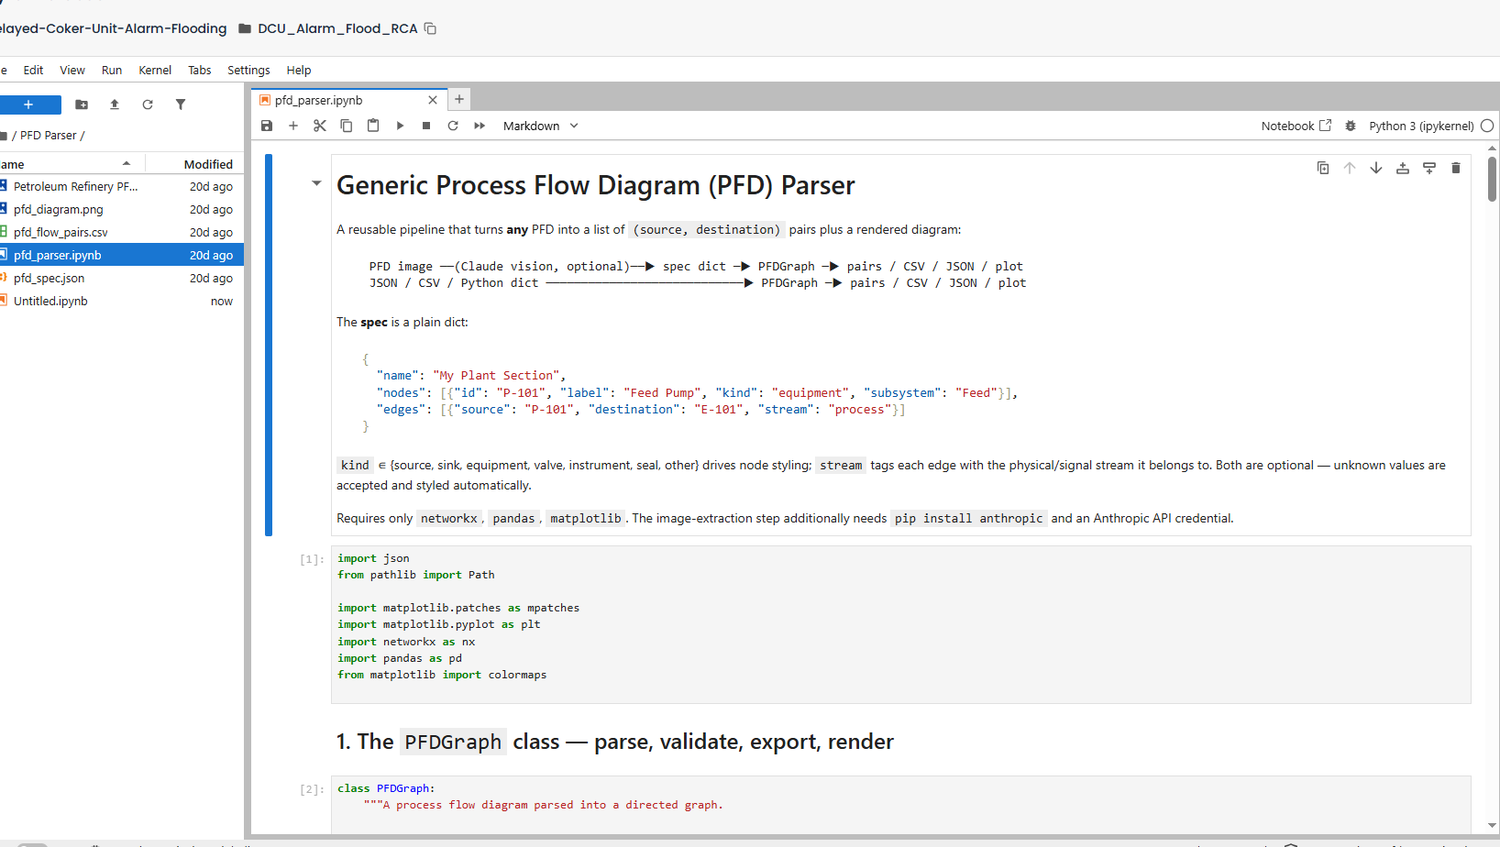
TRAIN screen: a Jupyter notebook inside the platform building a reusable pipeline that parses a process flow diagram into a directed causal graph, using networkx, pandas and matplotlib.
Integrating models and data from Jupyter: a notebook scripting root-cause analysis, recommendation and simulation directly against the governed model, in Python or R.Jupyter script for RCA, recommendation, simulation
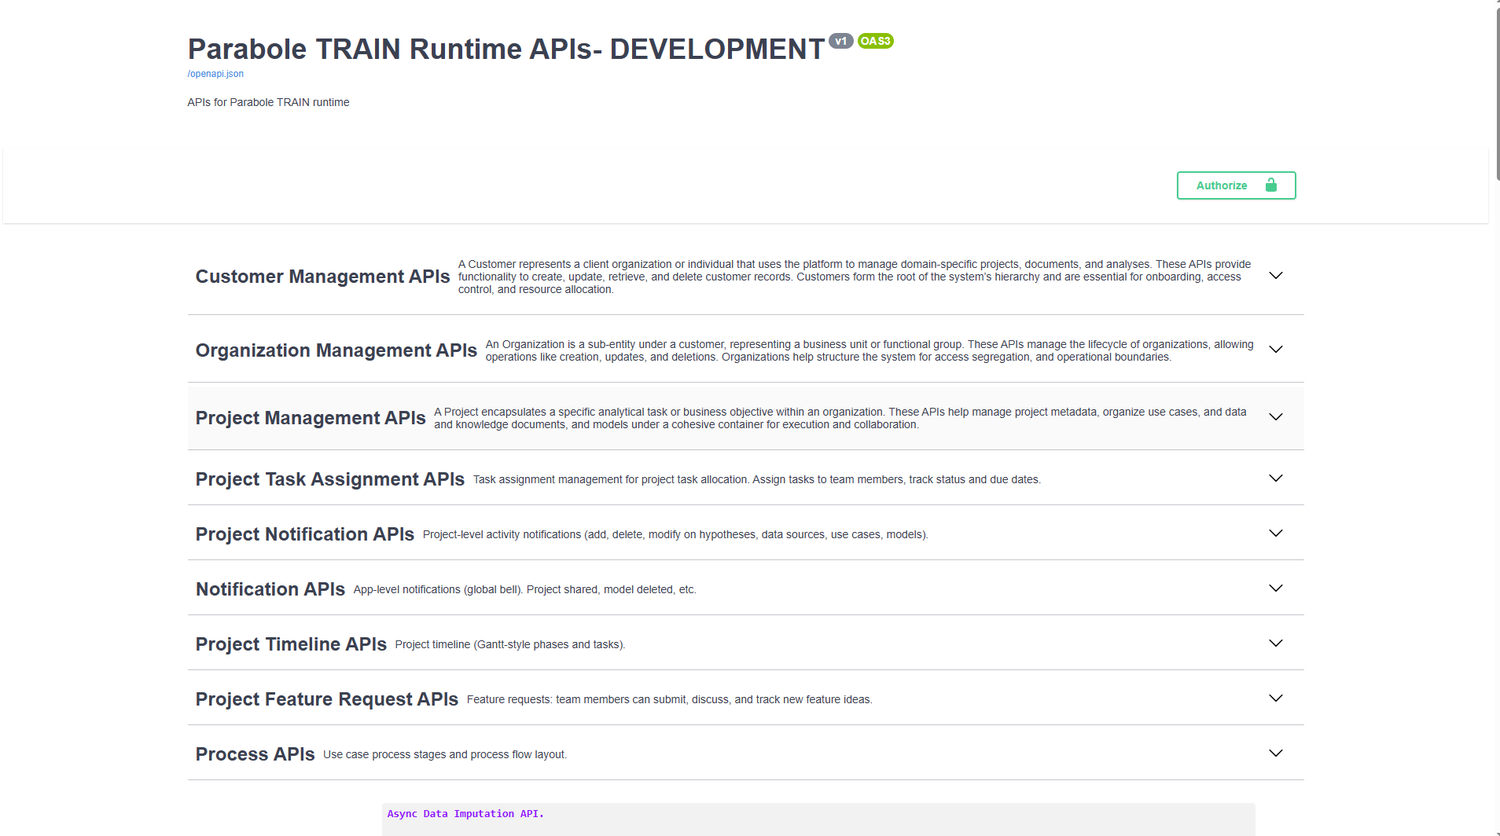
TRAIN screen: the runtime API documentation, an OpenAPI reference covering customer, project, process, hypothesis, model and analysis endpoints.
The TRAIN runtime API surface: core runtime capabilities are available through documented APIs for integration with customer workflows.API documentation
Utilities

One causal framework, four operational toolsets.

Once the causal model is validated against your modeling assets, it becomes the foundation for a broad range of industrial applications.

Root-cause analysis

Trace an operational outcome to supported causal drivers, with assumptions, evidence, validation status, and uncertainty visible to the user.

Counterfactual analysis

Evaluate “what-if” operating strategies, process adjustments and disturbances that may never have occurred, before implementing them.

Continuous monitoring

Monitor shifts in causal behavior and emerging risk indicators so teams can investigate developing conditions earlier.

Optimization

Feed validated causal effects and constraints into simulation, control and solver workflows for decision support and policy optimization.

Deployment and security

Runs in your environment. Managed by your team.

Can run entirely within customer-controlled infrastructure, including configurations that do not call external LLM APIs; control evidence and certification are provided through your architecture and cybersecurity review.

Customer-managed deployment

On premises or in your private-cloud tenancy, including restricted and low-egress environments. Topology is agreed at architecture review.

Your data does not leave

In approved customer-controlled configurations, operational data and models remain within the agreed perimeter; telemetry, support access, and training use are governed by contract and architecture review.

Identity and access from your stack

Single sign-on with your identity provider, and role-based permissions aligned to the no-code, low-code and high-code personas.

Auditable by design

Supported model, evidence, recommendation, and user events are logged with attribution and retained according to the configured policy.

Proof

From tribal knowledge to a daily plan.

Case

A large U.S. refiner managed semibatch lubricant-grade transitions using engineer-dependent judgment and delayed lab results, with no repeatable method. A Lube Blending Optimization agent built on TRAIN is ready to implement. It captures the expert knowledge through structured interviews, ingests process documentation and historical data, identifies the conditions that drove off-spec outcomes, and issues a daily engineering plan of optimal setpoints.

20% lower grade-transition losses · 22% throughput increase · 15% yield increase.

You don’t model the enterprise at once. Begin with one process, decision or deviation; because the framework is process-based rather than asset-specific, a working model extends across similar operations: a consistent causal layer that grows where it creates the most value. See the thirteen worked oil & gas decisions →

Get started

Bring us one decision that is hard to get right.

Bring the engineer who knows the process. We will walk through the causal model behind it and, if you want, scope a bounded paid pilot on one of your own problems.

Request a demo