Causal inference

Why causation, not correlation.

Causal inference is a branch of AI in which algorithms are rooted in the definition of cause-and-effect relationships between inputs and outputs. While classical AI/ML focuses on correlation-based prediction, causal AI aims to answer the same questions generatively, with clear structural definitions that allow one to attach an element of explainability to the results. This approach provides the basis for a more robust model and eliminates the black-box nature that has often been the bane of traditional machine learning.

01

Philosophy

Why cause matters, before the mechanics: the historical and conceptual case for causal reasoning over correlation.

A short history

The long road to why.

A quick look at cause and effect: 2,400 years from Aristotle’s big question to modern mathematics.

More than two thousand years ago, a Greek philosopher asked a simple question: why do things happen?

The question that started it all

His name was Aristotle. Around 350 BC, he argued that to truly know anything, you must know its cause. He went further. He said every “why” has four answers: what a thing is made of, what shape it takes, what brought it into being, and what purpose it serves. A bronze statue exists because of the bronze, the form of the sculpture, the sculptor’s hands, and the reason it was commissioned.

It sounds abstract today. But Aristotle did something profound. He made causation a subject worth studying. For the next two thousand years, that study belonged entirely to philosophy.

The philosopher who broke everything

In 1748, a Scottish philosopher named David Hume dropped a bombshell. He pointed out something unsettling. We never actually see causation. We see one billiard ball strike another. We see the second ball move. But the “cause” itself? Invisible. All we ever observe is one event following another, again and again. The connection between them lives in our minds, not in the world.

This became known as the problem of induction, and it haunted thinkers for centuries. If causation cannot be observed, how can it ever be proven? Science needed a way out. Philosophy alone could not provide it.

Enter the mathematics

The way out began with a quiet English clergyman named Thomas Bayes. Bayes died in 1761, and two years later his friend Richard Price published a paper Bayes had left behind. It introduced a formal way to update beliefs about hypotheses from observed evidence, a method that became foundational to probabilistic reasoning, although probability alone does not establish causation.

This was the moment causation left the armchair and entered the equation. It was called “inverse probability” then. We call it Bayes’ theorem now. It sat quietly for two centuries. Today it powers spam filters, medical diagnosis, and modern artificial intelligence.

A map, a pump, and a plague

The first great real-world test of causal thinking came in London, in the summer of 1854. Cholera was tearing through the Soho district. Hundreds died within days. The experts of the day blamed “miasma” (bad air rising from the filth of the city). Almost everyone believed it. One physician did not. His name was John Snow. He suspected the water.

Snow did something no one had done at this scale before. He walked the streets and marked every death on a map. A pattern emerged. The deaths clustered around a single water pump on Broad Street. People who drank from it died. People nearby who drank from elsewhere (brewery workers with free beer, inmates of a workhouse with its own well) were spared.

Snow went further. Two water companies supplied the same neighbourhoods, street by street, house by house. One drew its water from a sewage-polluted stretch of the Thames. The other had moved its intake upstream. Same air, same streets, same people. Different water. The customers of the polluted supply died at many times the rate of the others. Nature had run an experiment, and Snow had the wit to read it.

Snow’s mapping and natural-experiment evidence strongly implicated contaminated water. He persuaded the local council to remove the handle of the Broad Street pump. The outbreak was already subsiding, but the pump-handle intervention became emblematic of epidemiological causal reasoning. Snow had no germ theory (bacteria would not be identified for decades), yet he had found the cause with logic, data, and shoe leather.

The great friction

You might expect statistics to embrace causation after that. It did the opposite. In the late 1800s, Francis Galton and his brilliant student Karl Pearson built the foundations of modern statistics. Pearson gave us the correlation coefficient, a precise measure of how two things move together. But Pearson went further, and in the wrong direction. He declared that correlation was all there was. Causation, he said, was a fetish of the pre-scientific mind. Unmeasurable. Metaphysical. Not the business of statistics.

The mantra “correlation is not causation” was born in this era. It was meant as a warning. It became a wall. For nearly a century, mainstream statistics refused to even write the word “cause” in its equations.

There were rebels. In the 1920s, a geneticist named Sewall Wright invented “path analysis”, diagrams with arrows showing how causes flow to effects. Statisticians ignored him. The great Ronald Fisher offered a partial escape: the randomized controlled experiment. Randomly assign a treatment, and the cause reveals itself. It was brilliant, and it remains the gold standard. But you cannot randomize everything. You cannot assign smoking to one group of children and clean air to another.

And here the friction turned bitter. When studies in the 1950s linked smoking to lung cancer, Fisher himself (the giant of statistics, and a devoted pipe smoker) fought the conclusion. Mere correlation, he insisted. Perhaps some hidden gene caused both the craving and the cancer. He was wrong. The episode showed the public-health cost of delaying action while causal evidence was debated.

Causation sneaks back in

The thaw began, of all places, in economics. In 1969, a British economist named Clive Granger asked a practical question about time. If knowing the past of one signal helps you predict the future of another, beyond what its own past can tell you, then the first signal carries something real. He called it causality, Granger causality.

Purists noted, correctly, that it was really about prediction, not true causation. Granger knew this himself. But it did not matter. For the first time, a respectable, testable, mathematical definition with the word “cause” in it sat inside mainstream statistics. Economists used it everywhere: money and income, oil and growth, policy and markets. In 2003, Granger shared the Nobel Memorial Prize in Economic Sciences with Robert Engle for methods of analyzing economic time series. The wall had cracked.

The man who gave machines a why

The wall finally fell because of a computer scientist named Judea Pearl. In the 1980s, Pearl was teaching machines to reason under uncertainty. He built Bayesian networks, webs of probability that let computers weigh evidence the way Bayes had imagined two centuries earlier. They worked beautifully. But Pearl noticed something missing. His networks could tell you that yellow fingers and lung cancer go together. They could not tell you that scrubbing your fingers would not prevent cancer.

So Pearl did what Pearson said was impossible. He built a mathematics of causation itself. He revived Sewall Wright’s forgotten arrows and made them rigorous. He drew a sharp line between seeing and doing: between observing that patients who take a drug recover, and intervening to give them the drug. He invented a calculus, the “do-calculus,” that tells you exactly when data alone can answer a causal question, and when it cannot.

Pearl described a ladder of reasoning. On the first rung sits association: what does seeing X tell me about Y? On the second sits intervention: what happens if I do X? On the top rung sits imagination: what would have happened, had I acted differently? Animals live on the first rung. So, Pearl pointed out, does almost all of machine learning. Humans live on the third. That gap, he argued, is why systems that only find patterns will always hit a ceiling.

His 1988 book transformed artificial intelligence. His 2000 book, Causality, transformed statistics. In 2011, he received the Turing Award, computing’s highest honor. Alongside him, statisticians like Donald Rubin built a parallel framework of “potential outcomes,” asking of every patient, every policy, every decision: what would have happened otherwise? The two schools argued fiercely and, together, finished the revolution.

Why it matters now

Today, the science of causation is everywhere, quietly solving real problems. Epidemiologists used it to untangle what actually works against a pandemic. Economists used natural experiments (John Snow’s trick, formalized) to measure the true effect of education, minimum wages, and immigration; that work won the Nobel Prize in 2021. Doctors use it to read evidence when a randomized trial is impossible. Courts use it to weigh liability. Tech companies use it to learn what their products actually change, not merely what they coincide with.

And in industry, the newest frontier has opened. Modern machine learning is a magnificent pattern-finder, but patterns break the moment the world shifts. A model trained on yesterday’s factory fails silently when a machine ages, a supplier changes, a process drifts. Causal models can make assumptions and failure conditions more explicit, helping teams diagnose when a model no longer fits the operating regime. They can help answer the questions that matter on a plant floor or in a boardroom: what is the root cause? What happens if we intervene? What would have happened if we hadn’t?

It took twenty-four centuries. Aristotle asked why. Hume showed why the question was hard. Bayes gave it numbers. Snow gave it a map. Pearson banished it. Granger smuggled it back. Pearl gave it a language. The question was never the problem. We simply needed two thousand years to learn how to answer it.
A comparison

Causal models vs. context graphs.

A 2025 venture thesis proposed the “context graph” (a system of record for decisions) as a potentially valuable new software layer. It aims at the same gap Parabole does: the “why” that lives in people’s heads and is never treated as data. The two answers are not cosmetically different. They are epistemically different.

Both approaches accept the same premises: tribal knowledge is the unmined asset, a queryable “why” layer is the durable moat, incumbents cannot retrofit it, and knowledge has to compound over time. Where they part ways is on what “why” means.

A context graph captures decision traces (exceptions, overrides, approvals, precedents) as first-class data at execution time. Its “why” is organizational: which policy applied, who approved, what precedent governed. Precedent becomes searchable.

A causal model captures first principles, expert and organizational reasoning, and structure learned from data, and fuses them into one governed model that is refutation-tested and uncertainty-quantified. Its “why” is mechanistic: what drives what, by how much, under which conditions.

DimensionContext graphCausal model (TRAIN)
Epistemic unitA decision trace: a record that a decision was made and allowedA validated causal relationship: refutation-tested, with a confidence range
Truth standardReplayability of the state at decision timeRefutability: applicable placebo, invariance, sensitivity, and identification checks inform whether an estimate is reported
Knowledge growthPassive: traces accumulate into precedentActive: principle, rationale and structural models fused into one governed combined model
Novel situationsPrecedent search: interpolation over what has already happenedModel-based counterfactuals: evaluating unobserved scenarios when assumptions and the operating envelope remain valid
Bad historyWrong decisions become searchable precedent like any otherSpurious relationships fail refutation and are flagged as weak evidence
Domain of gravityBusiness workflows: deal desks, underwriting, escalationsPhysical and industrial processes governed by physics
Position in the stackIn the write / orchestration path; aims to become the new system of recordA causal layer above the existing estate; no re-platforming
Why causal wins where it matters
01

A trace records a decision, not that it was right

Decision traces can preserve both good and bad precedent: “we always did it this way” can become authoritative if nothing tests it. TRAIN adds explicit causal testing, engineering review, and outcome validation before precedent is treated as evidence.

02

Precedent is limited; a validated model can extend further

Context-graph autonomy grows only as similar cases repeat. For genuinely novel conditions (a new feedstock, a new operating regime, a disturbance no one has seen), precedent search may provide weak or incomplete analogies. A validated causal model can extend further when its assumptions and operating envelope remain valid.

03

Industrial ground truth reconciles physics with policy

Industrial decisions must reconcile physical mechanisms with operating policy, safety, economics, and human judgment. TRAIN is designed to represent those layers together, rather than treating approval alone as the terminal justification.

An honest concession. For exception-heavy business workflows (deal desks, underwriting, escalations), the context graph is the right tool, and a causal model is not aimed there. The context-graph thesis is an argument about market structure, not about method.

A context graph tells you what the organization decided, and why it was allowed. A causal model tells you what the system will do, and why it must.
Parabole ยท TRAIN

The two are not mutually exclusive. Decision traces are a natural input to a causal model: accumulated precedent feeds the rationale layer, and the refutation suite tests it. TRAIN records decision context and tests causal claims through refutation, sensitivity analysis, engineering review, and outcome tracking.

In the analyst landscape. LNS Research’s Industrial AI market landscape puts causal reasoning in its own category (“Agentic Operations”, the companies building decision intelligence from knowledge graphs, causal reasoning and autonomous agents rather than dashboards) and lists Parabole among them.

02

Causal foundation

The mechanics underneath: how a Combined Causal Model is built, estimated and refutation-tested.

No published piece here yet. Ask us for the technical detail directly.

03

Industry application

The thesis and the proof: how causal understanding replaces templatized failure-matching on the plant floor.

Technology thesis

From templatizing to causal understanding.

Rather than teaching AI to recognize historical examples, we teach it to understand how industrial systems behave, so operators can act on the long-tail scenarios they have never seen before.

Most AI learns from labeled examples

A classification model learns what a compressor failure looks like because it has seen many instances of compressor failure. That approach is strongest when future conditions resemble the training distribution and weakens as operating conditions shift beyond it. Industrial operations often shift.

Think about seal gas leaks in upstream oil and gas operations. A leak can develop in hundreds of different ways, and the timing, affected equipment, sensor behavior and process conditions vary vastly from one event to the next. A model trained on previous leak patterns recognizes familiar cases, but reaches its limits when confronted with a new variation, and building a separate model for every possible variation is neither practical nor scalable. The challenge is not recognizing yesterday’s anomalies. It is understanding today’s operating reality.

Start from the baseline, not the anomaly

Instead of asking “what failures have we seen before?”, the platform asks “how should this system behave under normal operating conditions?” To answer that, TRAIN continuously scans operational time-series data to decode the true baseline of normal system behavior. In place of memorizing individual sensor values or historical events, it learns the causal relationships that consistently govern interactions between assets, process variables, control actions and operating conditions.

The resulting baseline becomes the reference model for the entire operation. It captures not only expected operating values, but also the structure, direction and strength of the key relationships that characterize healthy system behavior. Even root-cause analysis traditionally begins with the anomaly and works backward. Parabole begins with the baseline, so every new operating condition can be evaluated as a deviation from normal rather than as an isolated event.

One causal model, many scenarios within its validated envelope

Instead of searching for a matching historical example, the platform asks whether the system is still behaving according to its expected causal relationships, across three dimensions: whether the expected causal structure remains intact, whether relationships still influence one another in the expected direction, and whether the strength of those relationships is consistent with the established baseline.

One governed causal framework can evaluate many operating scenarios without requiring a separate classifier for every known failure sequence. Instead of juggling hundreds of specialized models for different alarm sequences and failure modes, the platform evaluates every new scenario against the same underlying model of how the system is expected to behave.

A workshop

Building smarter enterprises with causal AI.

From the workshop on multi-agency optimization presented at the ARC Industry Forum: how one causal model turns three planning functions that fight each other into agents that plan together.

Three functions, three objectives, one plant

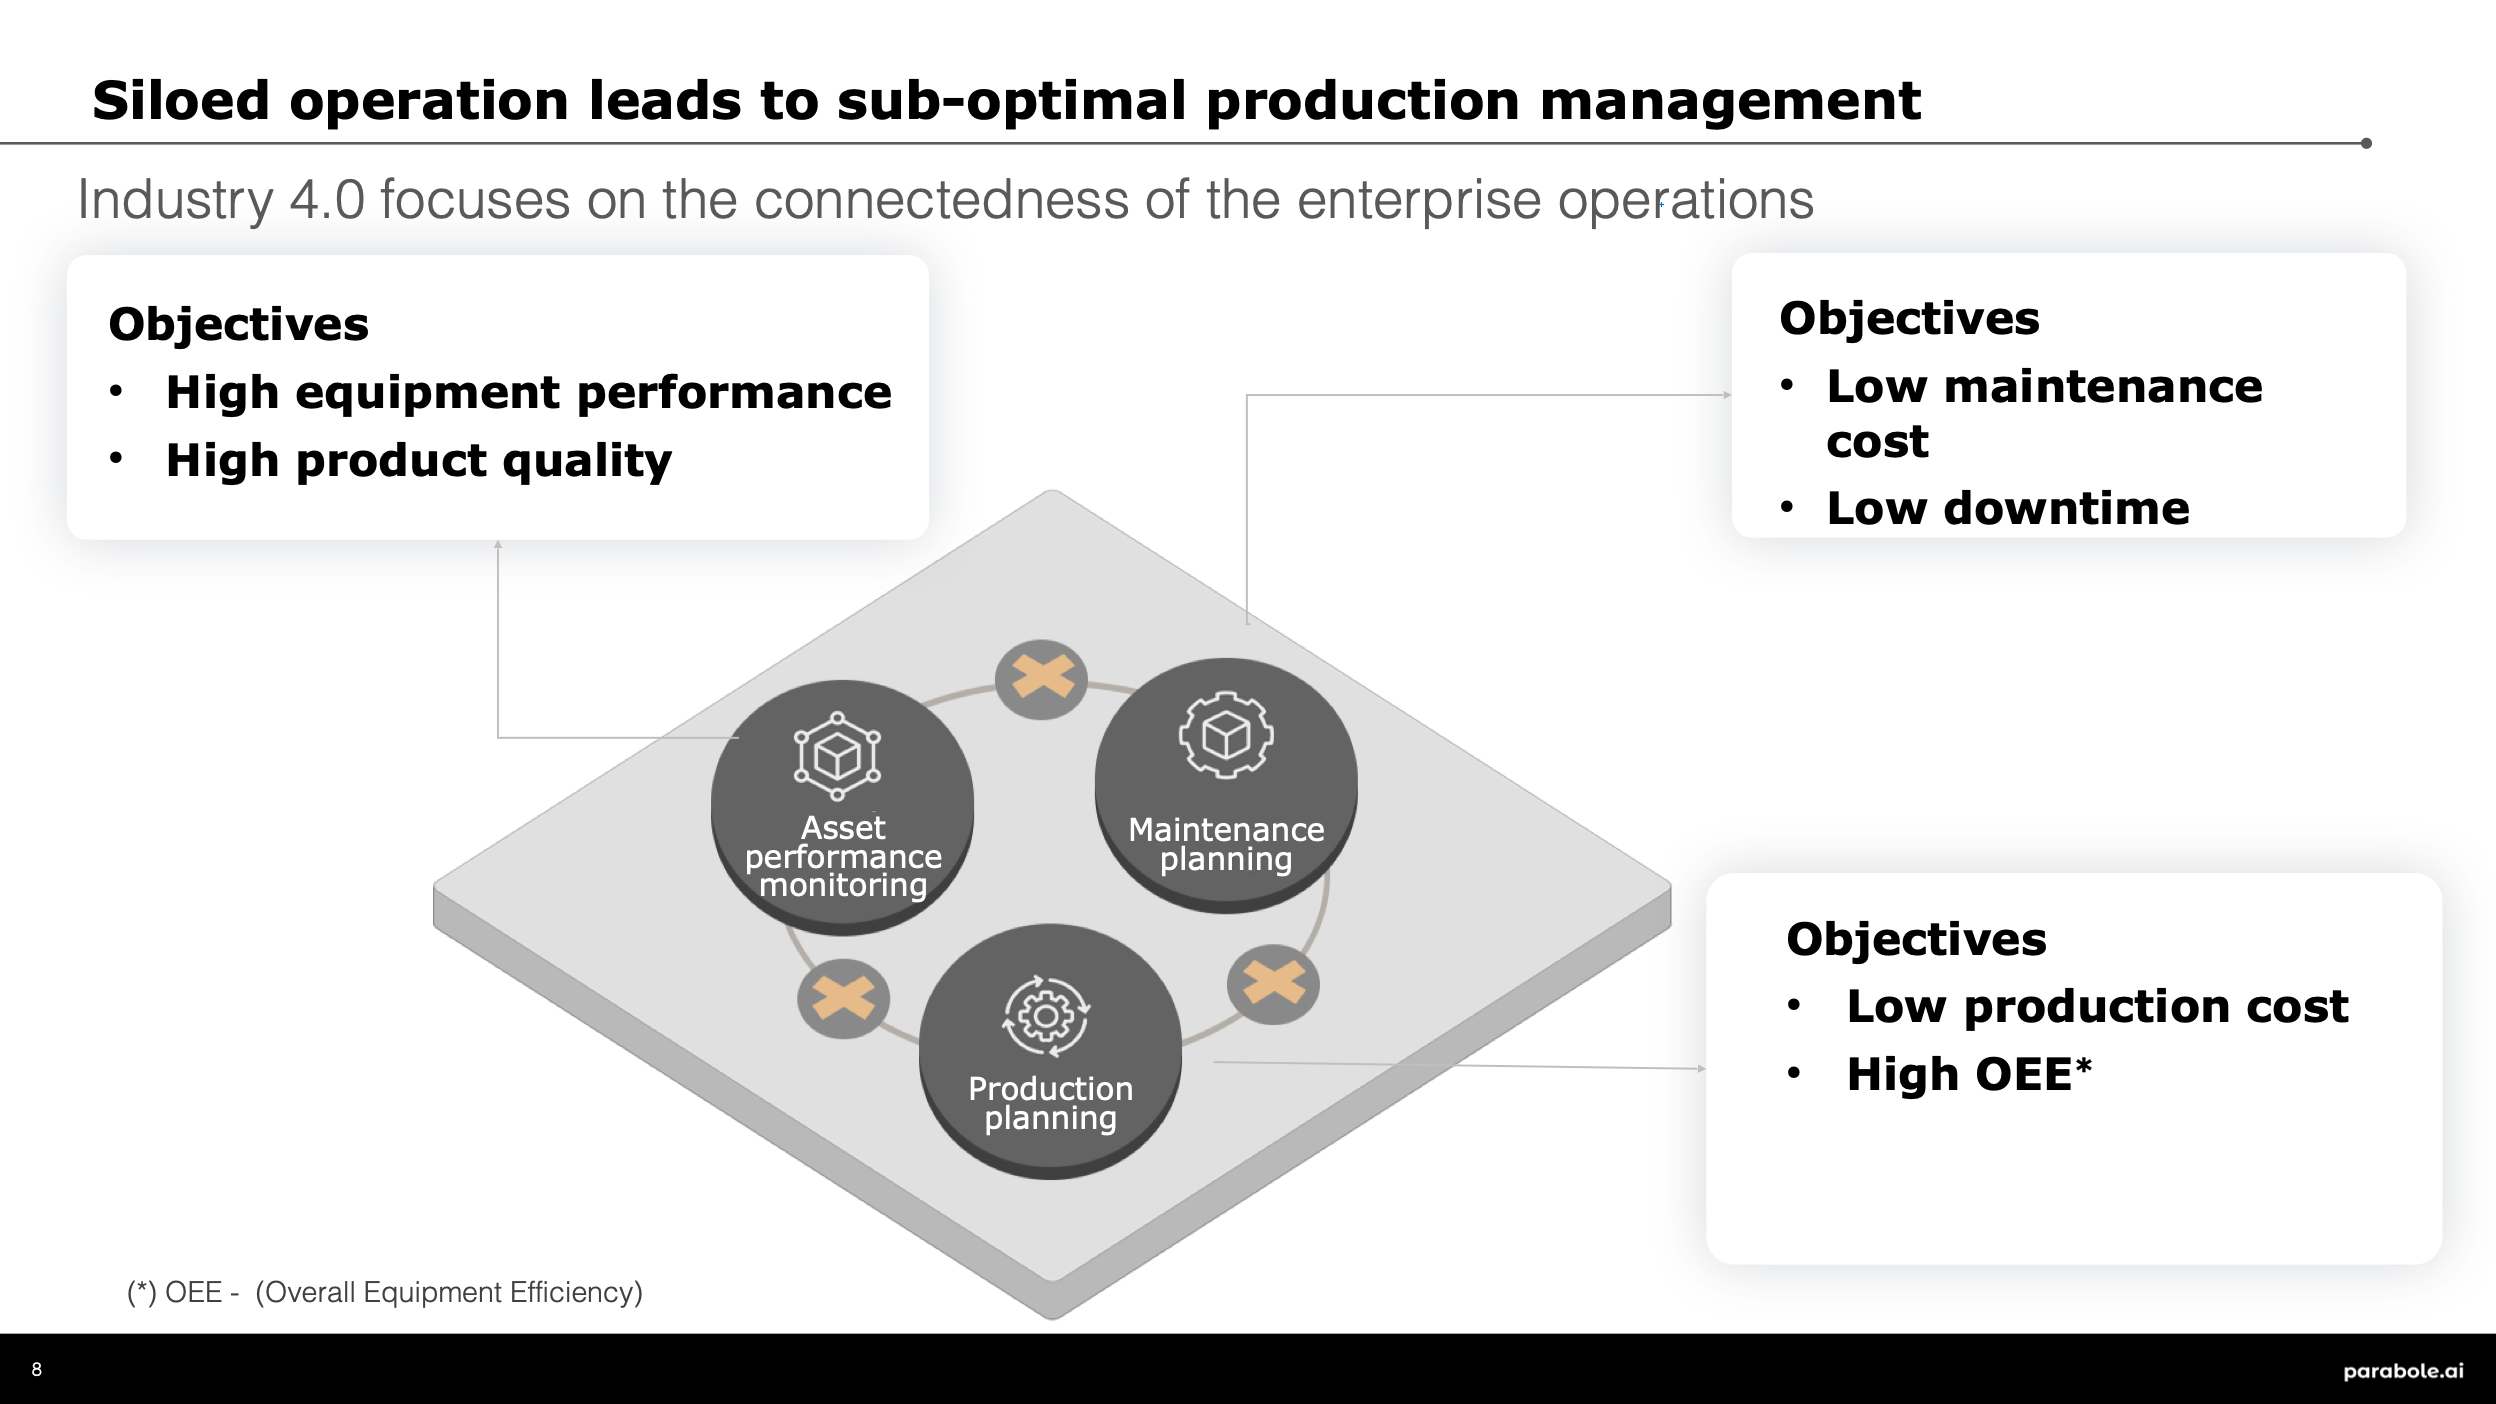
A plant runs on three planning functions that rarely share a model. Production planning wants low unit cost and high OEE. Maintenance planning wants low maintenance cost and low downtime. Asset-performance monitoring wants high equipment performance and high product quality. Planned in isolation each is locally sensible, and the plans collide on the floor: maintenance deferred to protect a production target becomes the unplanned outage that misses it. Industry 4.0 is the recognition that these functions have to be connected, but connecting the dashboards is not the same as connecting the decisions.

Isometric diagram from the workshop: three functions (asset-performance monitoring, maintenance planning and production planning) on one platform, with broken links between them and each carrying its own conflicting objectives (high equipment performance and quality; low maintenance cost and downtime; low production cost and high OEE).
From the workshop: siloed, the three functions optimize objectives that pull against each other.

Classical ML cannot harmonize them

The knowledge that links the three functions (how a maintenance deferral actually propagates to yield, how a grade change actually loads the equipment) is causal, scarce, and mostly undocumented in the heads of the people who run the process. Forecasts built independently for each function do not, by themselves, estimate cross-functional intervention effects. A shared causal model can make those dependencies explicit.

One combined causal model

Parabole combines first-principles relationships (the Principle Causal Model), engineering reasoning (the Rationale Causal Model), and structure learned from IT and OT data (the Structural Causal Model), then tests and governs the combined model. It encodes what drives OEE and by how much, under which conditions.

Seeing, doing, imagining: one model, three modes

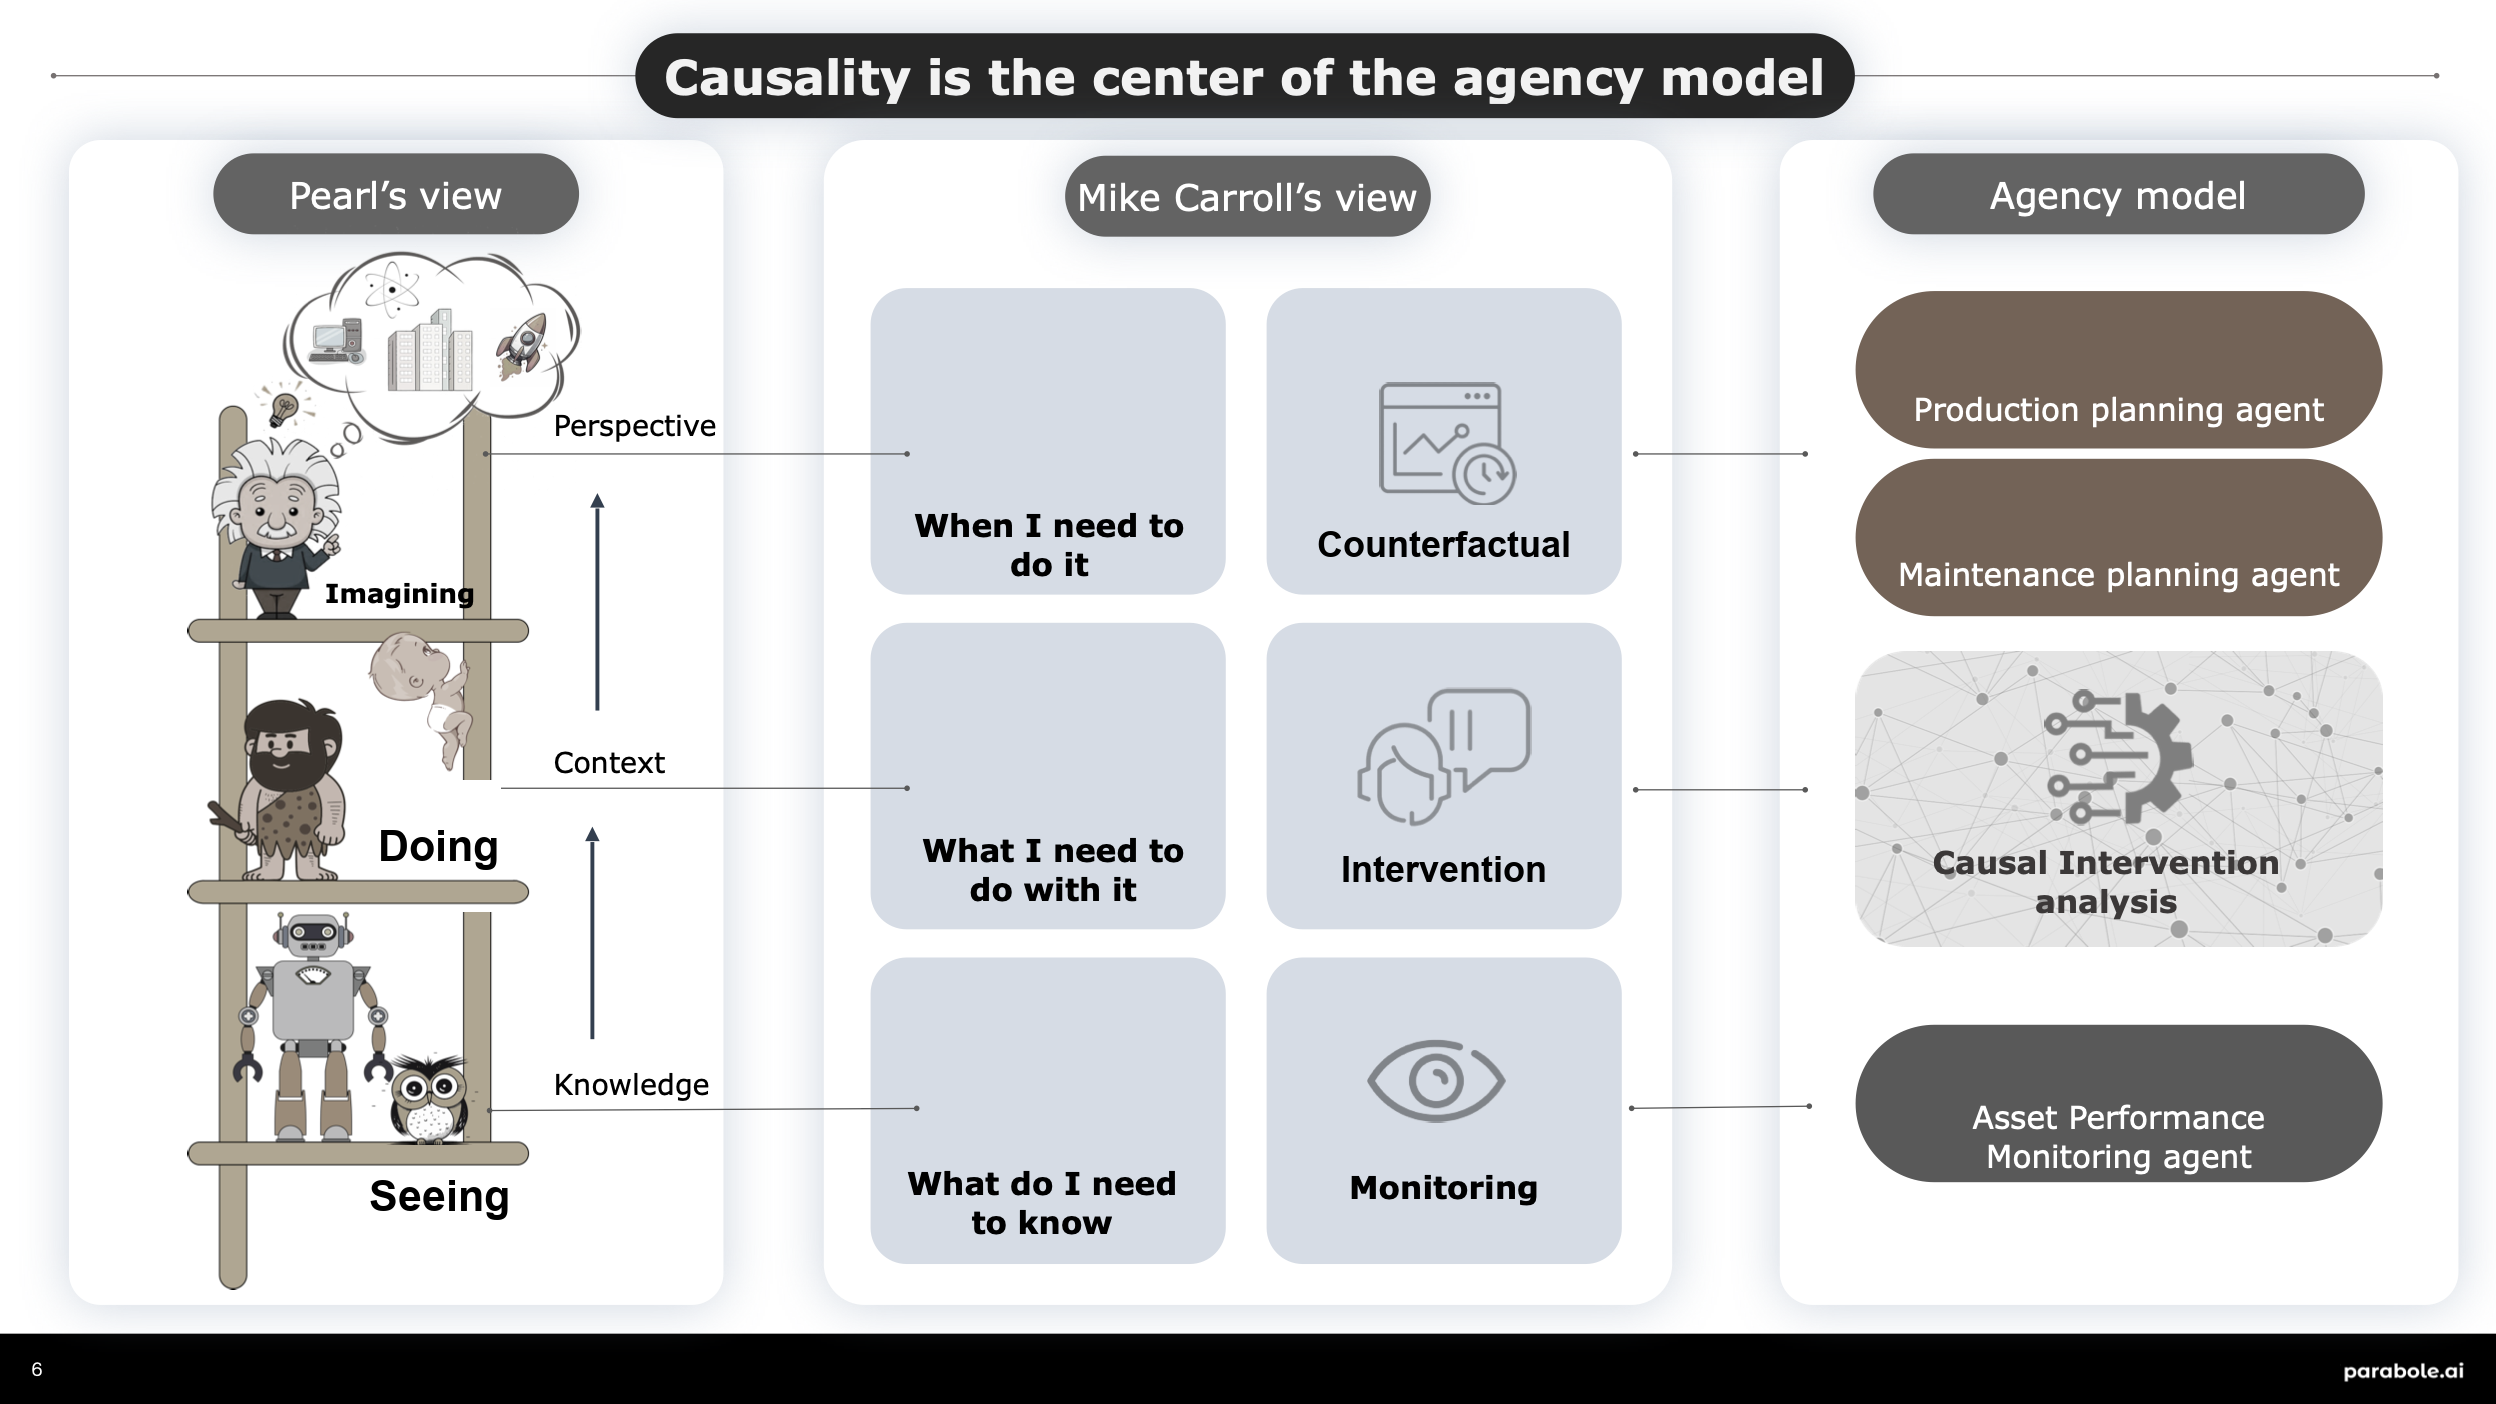
Judea Pearl’s ladder of causation names three ways to use a causal model. Seeing: is the process off its causal baseline right now? Doing: which lever moves the outcome, and by how much? Imagining: what would have happened had we acted sooner? One plant operator involved in the workshop frames the same three as an operator’s questions: what do I need to know, what do I do with it, and when. The same model answers all three.

Workshop diagram aligning three views: Pearl's ladder of causation (seeing, doing, imagining) against knowledge, context and perspective; an operator's questions (what do I need to know, what do I do with it, when) mapped to monitoring, intervention and counterfactual; and the agency model: production-planning agent, maintenance-planning agent, causal-intervention analysis and asset-performance monitoring agent.
From the workshop: Pearl’s ladder, the operator’s questions, and the agency model line up rung for rung.

Functions become coordinated agents

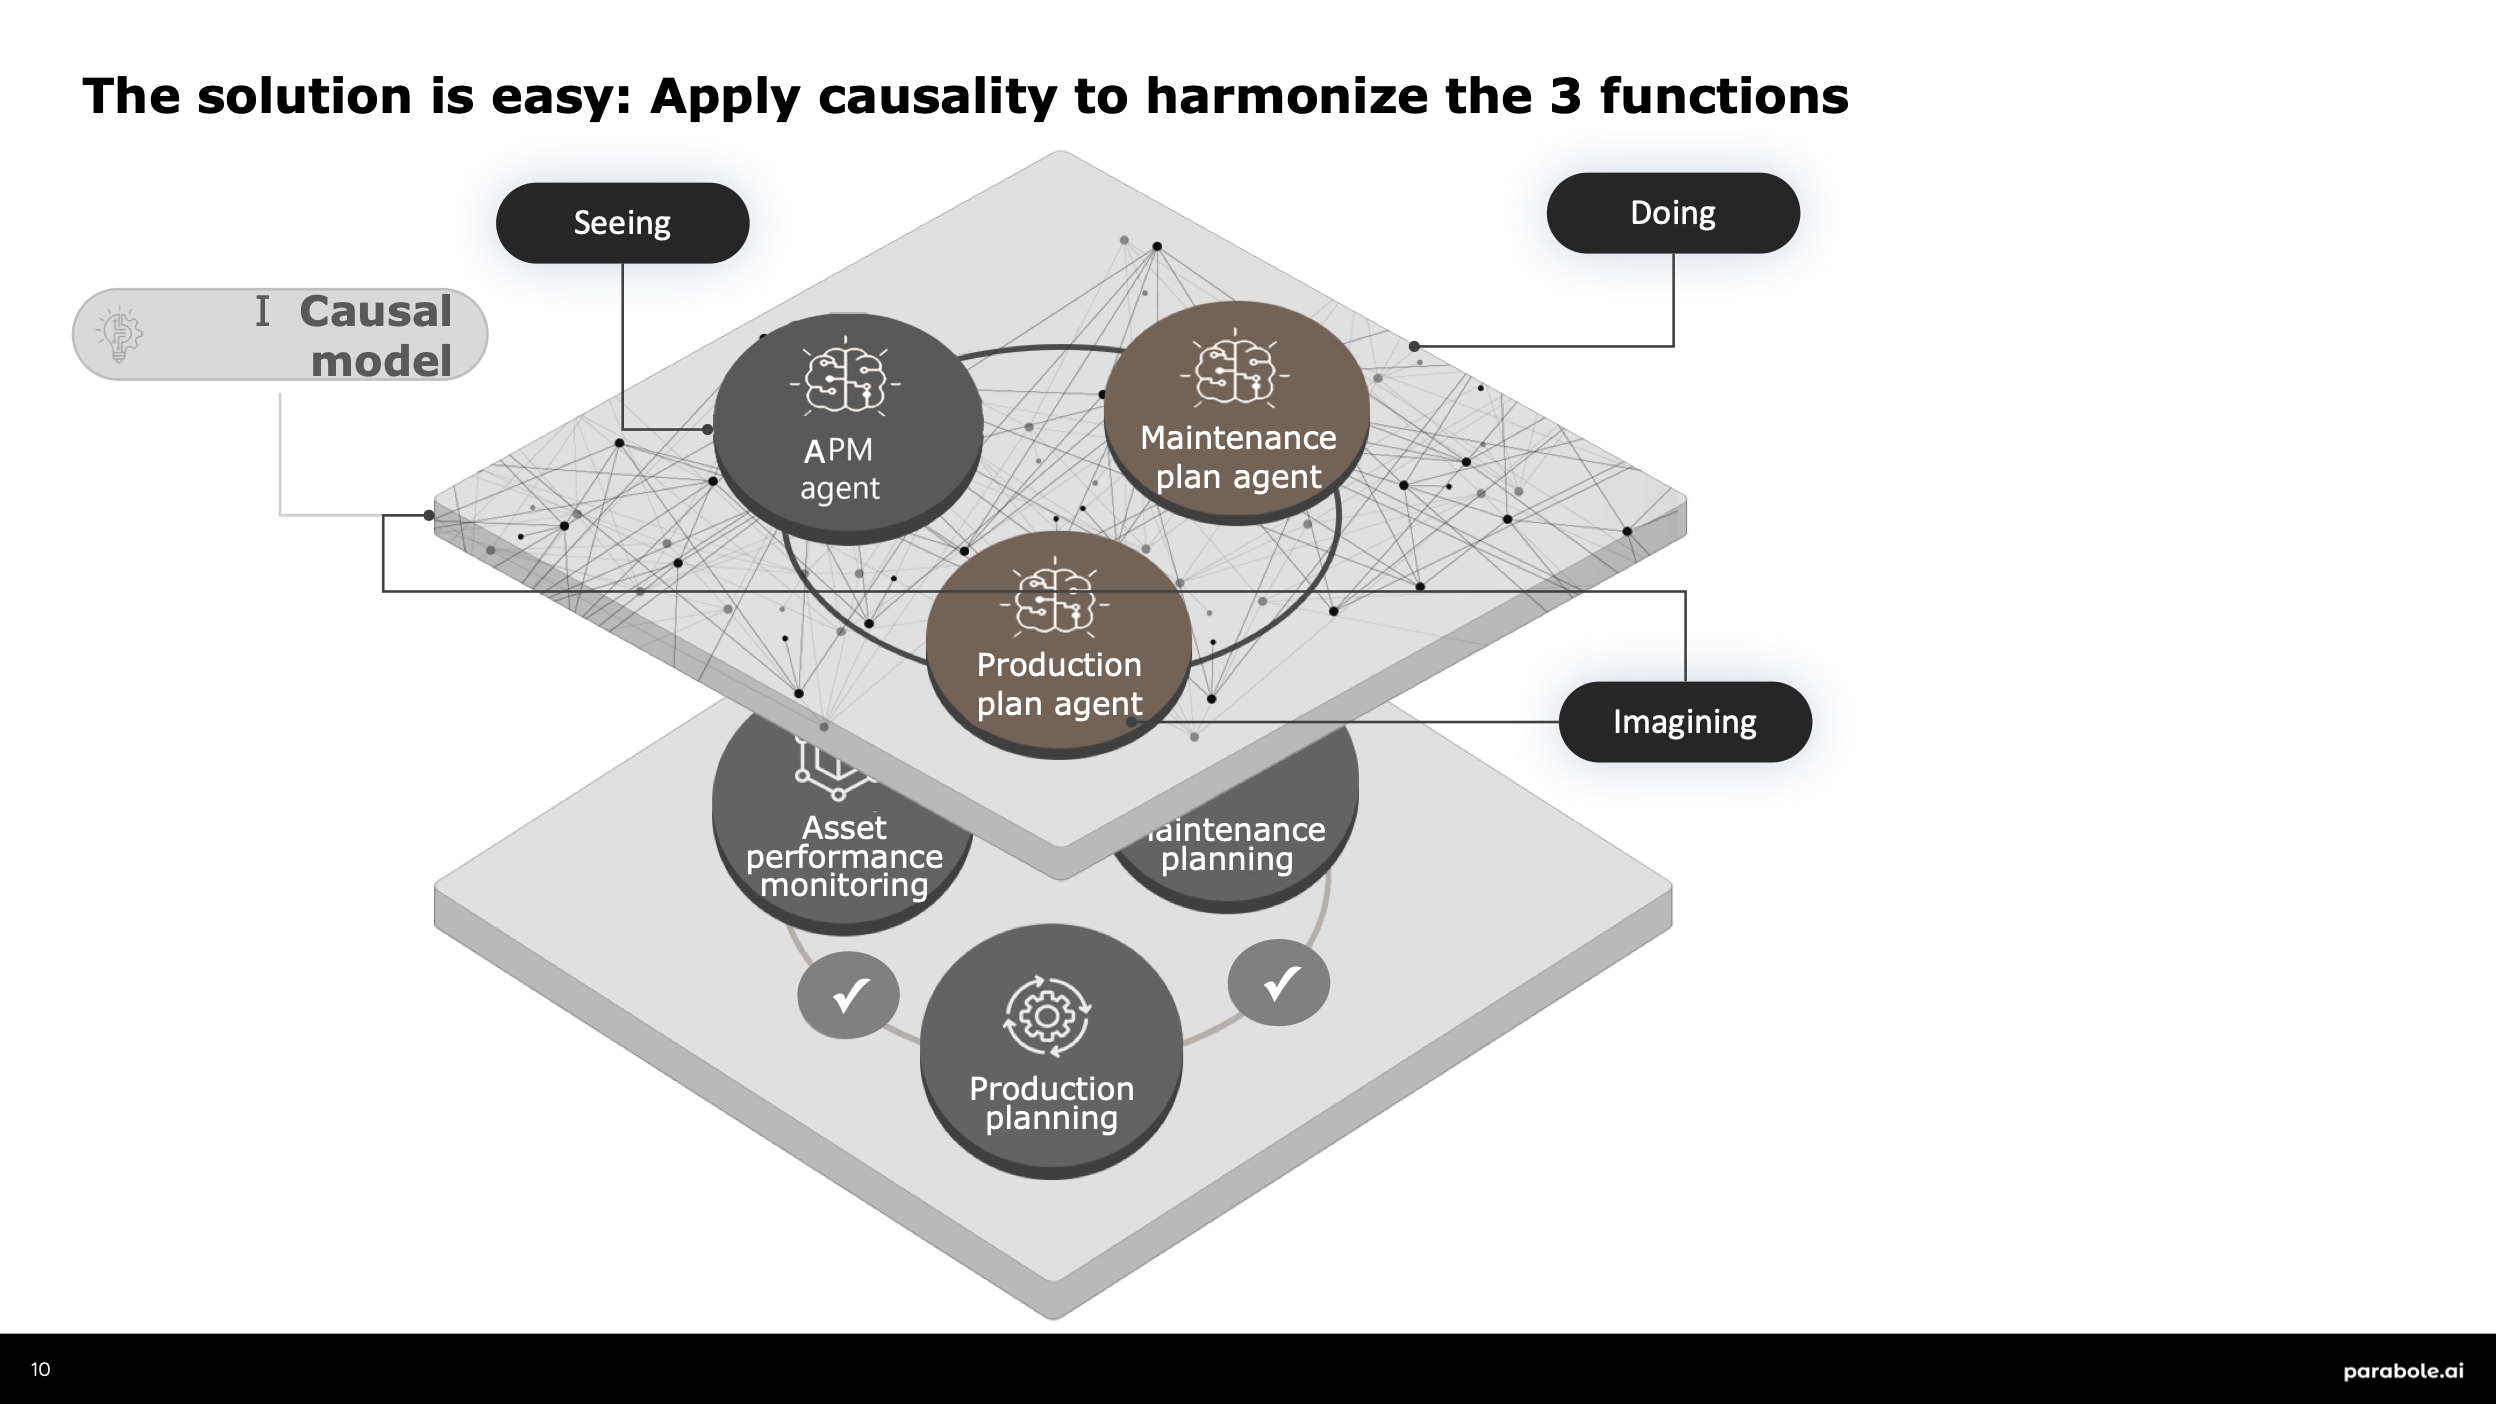
Once the three functions read the same model, each becomes an agent: an asset-performance monitoring agent watching for deviation from causal normal, a maintenance-planning agent timing work to its real effect on yield, a production-planning agent scheduling against both. They are not three models loosely integrated; they are one model, queried three ways, producing one coordinated plan whose objective is plant-wide OEE rather than any single function’s local metric.

In TRAIN, Automated Causal Model Generation builds the Principle, Rationale, and Structural models from data and expert knowledge. The Causal Solution Workbench supports analysis, hypothesis testing, validation, scenario simulation, and recommendations that the agents act on.

Workshop diagram: the three planning functions on a lower plane resolve upward, through one causal model, into a coordinated layer of agents (APM agent, maintenance-plan agent and production-plan agent) tagged seeing, doing and imagining.
From the workshop: apply causality to the three functions and they resolve into one coordinated set of agents.
04

Research and validation

The evidence: holdout results, refutation testing, and where a causal model has been checked against the world.

No published piece here yet. Ask us for validation results directly.

Get started

Bring us one decision that is hard to get right.

Bring the engineer who knows the process. We will walk through the causal model behind it.

Request a demo